Tracking progress
There are a number of reports built into Moodle, Panopto and Webex that offer tutors lots of information on student activity. That information can be used to monitor student engagement, to evaluate the popularity of course resources, and to provide a detailed audit trail user activity.
Indicators available automatically in Moodle
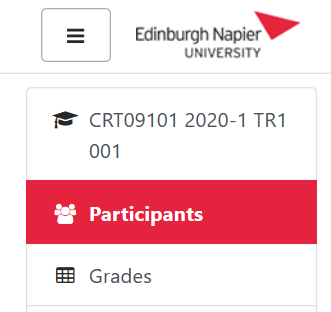 The Participants list shows the date/time of last access to the course. Provides link to each student’s Moodle profile and access to their
- Logs which is an itemised list of interactions with resources and activities in chronological order
- Outline reports which gives an overview of the course and the number of views against each item
-
Statistics which are connected to the Logs and can offer a broad overview, and we can generally see a peaks in the graphs around assessment points.
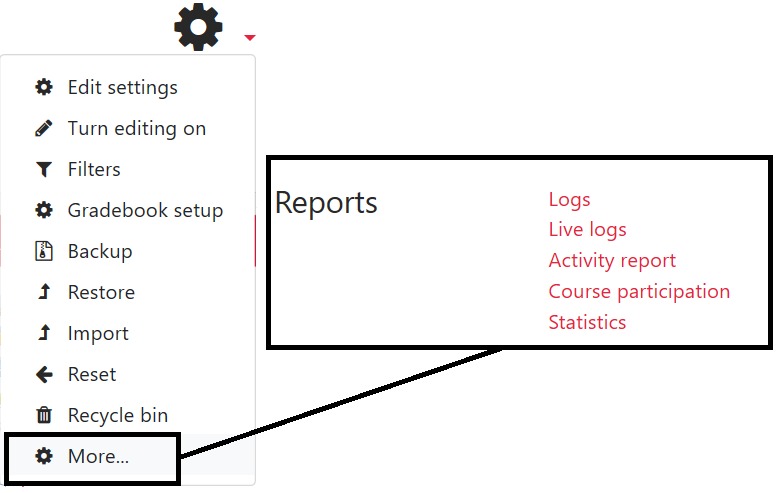 Reports for the whole course are available from the homepage Cog > More, and include the Participation reports which list the students who have participated in a given activity, and how many times. The report can be filtered by Groups and tutors can select students to message directly from the report.
Tutor initiated reports in Moodle
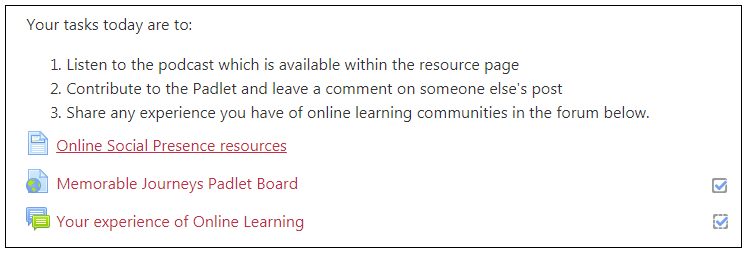
1. Activity Completion is a way to identify key course items that students tick as they go along, or are ticked automatically based on their action, eg. by completing a quiz.
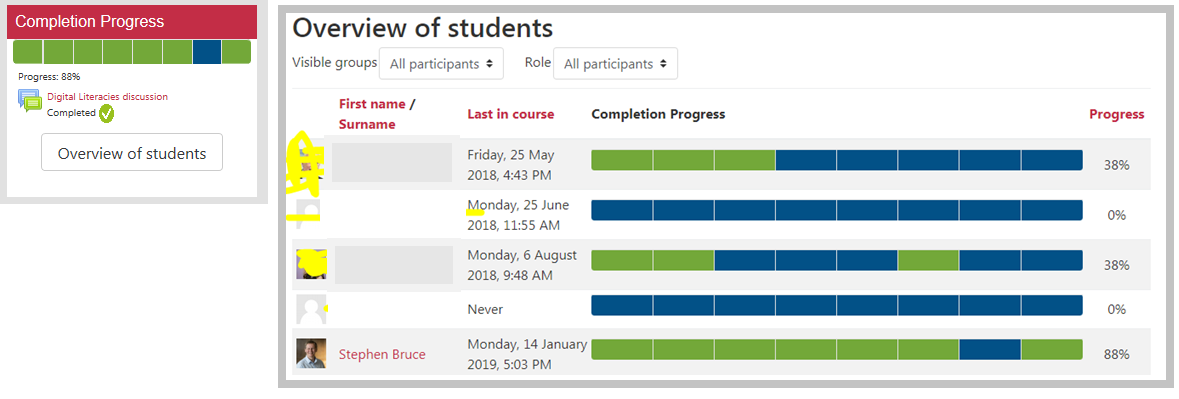 By enabling completion tracking in the course settings, a completion progress bar can be added for students to track their own progress, and provides tutors with an overview of the class progress. Completion tracking can also used in conjunction with ‘Restrict access’ so that the availability of resources are activities are dependant on the success completion of a prior activity.
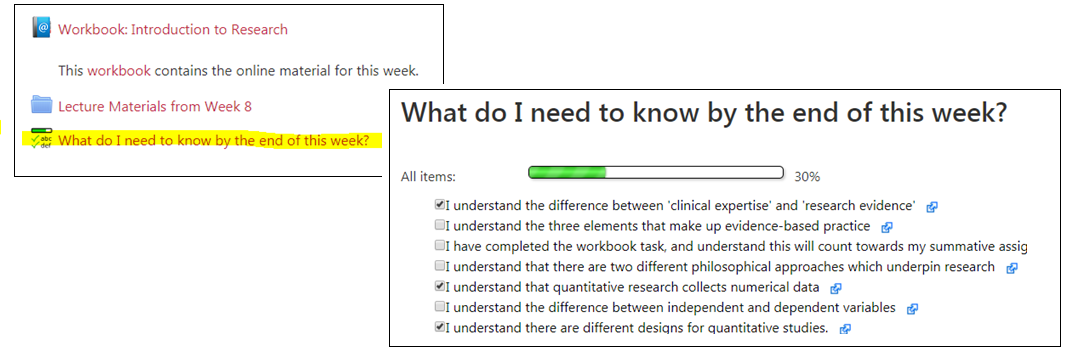
2. Checklists are simple lists that are manually added to the course for the students to indicate they have completed certain tasks. Checklists can be added anywhere in the course, eg. for each week, and can be a useful way for a tutor to define how students to keep on track.

Tutor view
Checklists can be associated with all items in a course, limited to the specific section, or completely ad-hoc tasks. Checklists can also be configured to allow students to add their own tasks. The tutor can view the overall % completion for each student, and can expand the view for the full details of each student’s completed tasks.
Watch the Checklist screencast for a video walk-through.
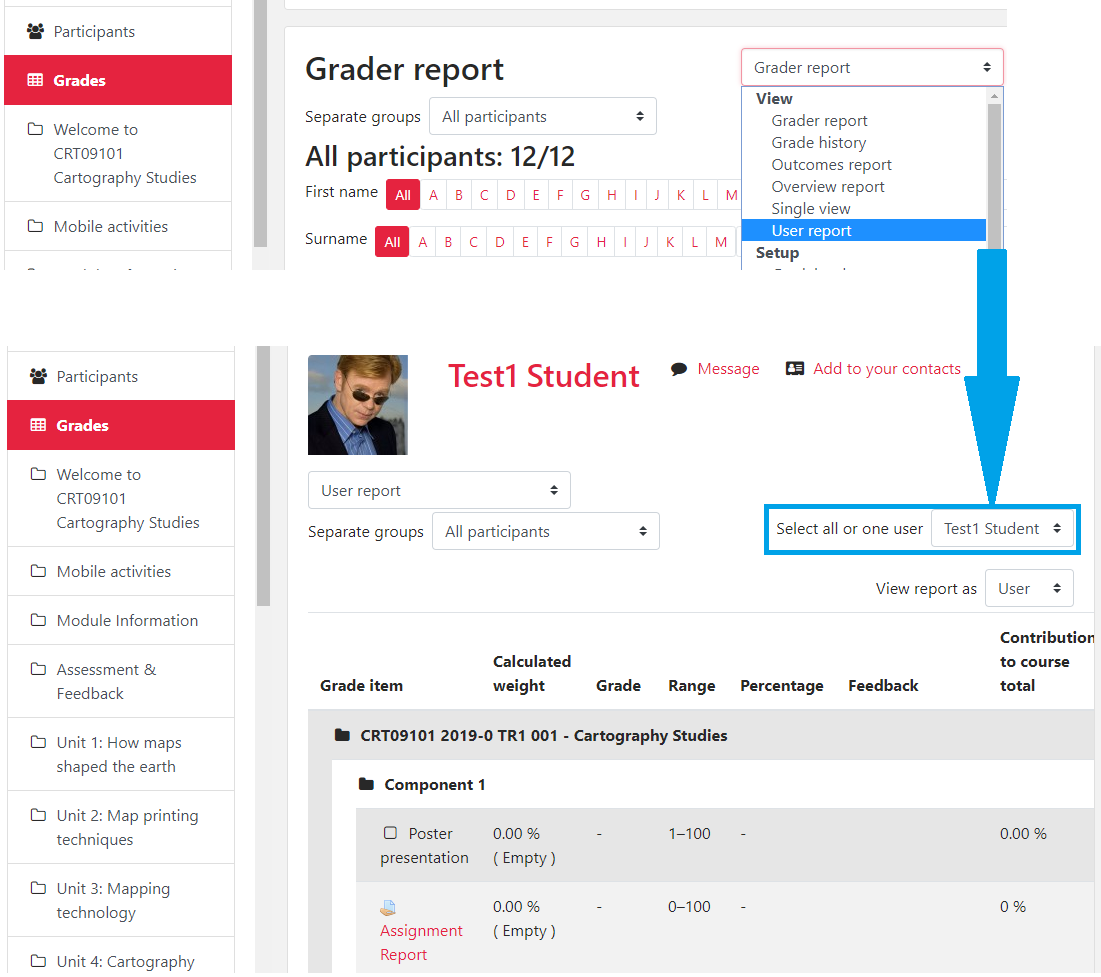 Finally, all Moodle activities that generate a grade are reported to the Gradebook, so before you release grades to students you should spot-check a few student’s user reports. This is the one area in Moodle where you can see the exact view of individual student’s grades (rather than Switch role to… which is only a generalised student view).
Panopto analytics
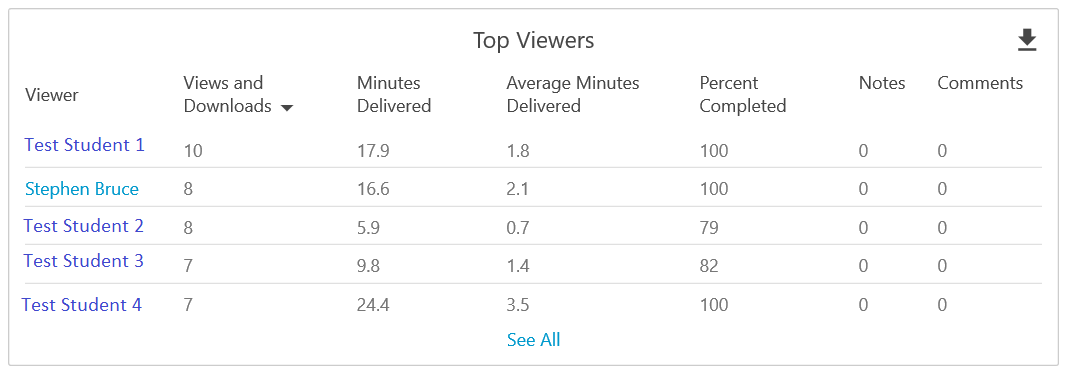
Panopto provides detailed reports on video popularity and audience engagement, with trendline reporting and video drop-off rates to help show where viewers began to click away. The table below lists the student viewers which can be arranged alphabetically, by number of views, minutes delivered, and other interaction types.
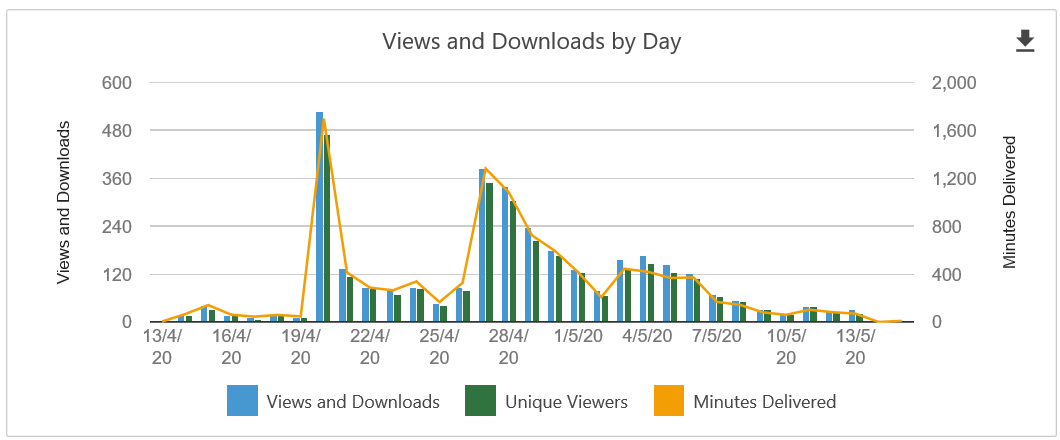 The Views and Downloads graph shows the total number of views and the number of unique people who have accessed this video, and the number of minutes streamed and downloaded combined.
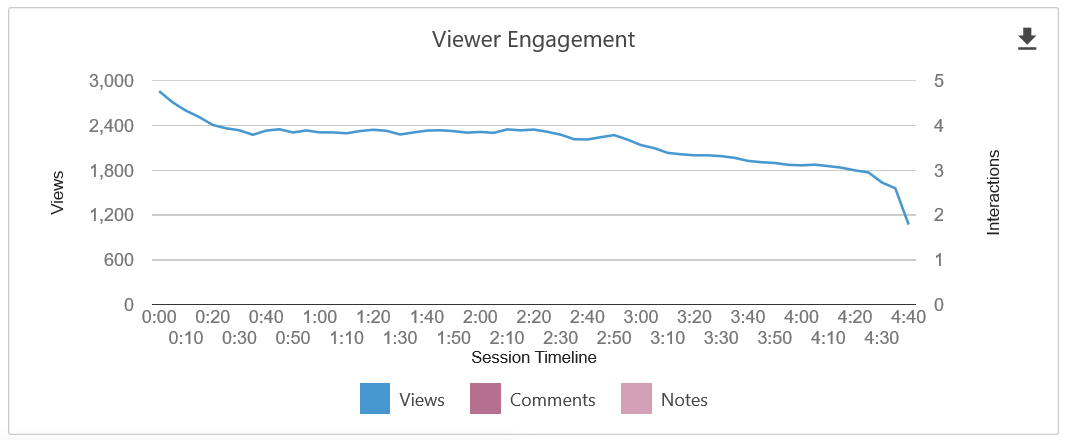 The Viewer Engagement graph details the number of views at each point in the video, and also the type of interactions (Views, Comments, Notes). This is useful for identifying parts of a video which students are viewing repeatedly, such as difficult concepts.
Webex attendance
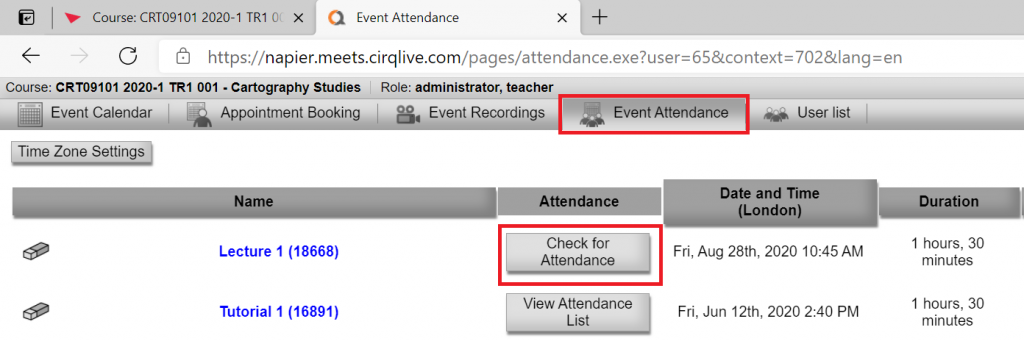
If you have scheduled Webex Meetings through Moodle then the Event Attendance tab will allow you to view and download an attendance list.
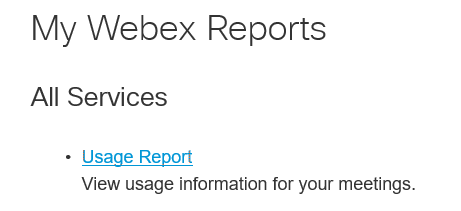
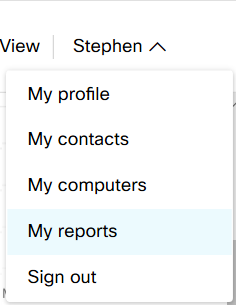 If you have scheduled Meetings directly in the Webex portal then you can generate usage reports that provide attendee information. Note that reports are limited to the previous three months. Login to https://edinburghnapier.webex.com and click your name at the top right of the page, and then click My reports.
A general usage report contains summary information about each event including those who attended. Note that initially, this report appears as a Preliminary Usage Summary Report, but after 24 hours it is replaced by the more accurate Final Usage Summary Report.