

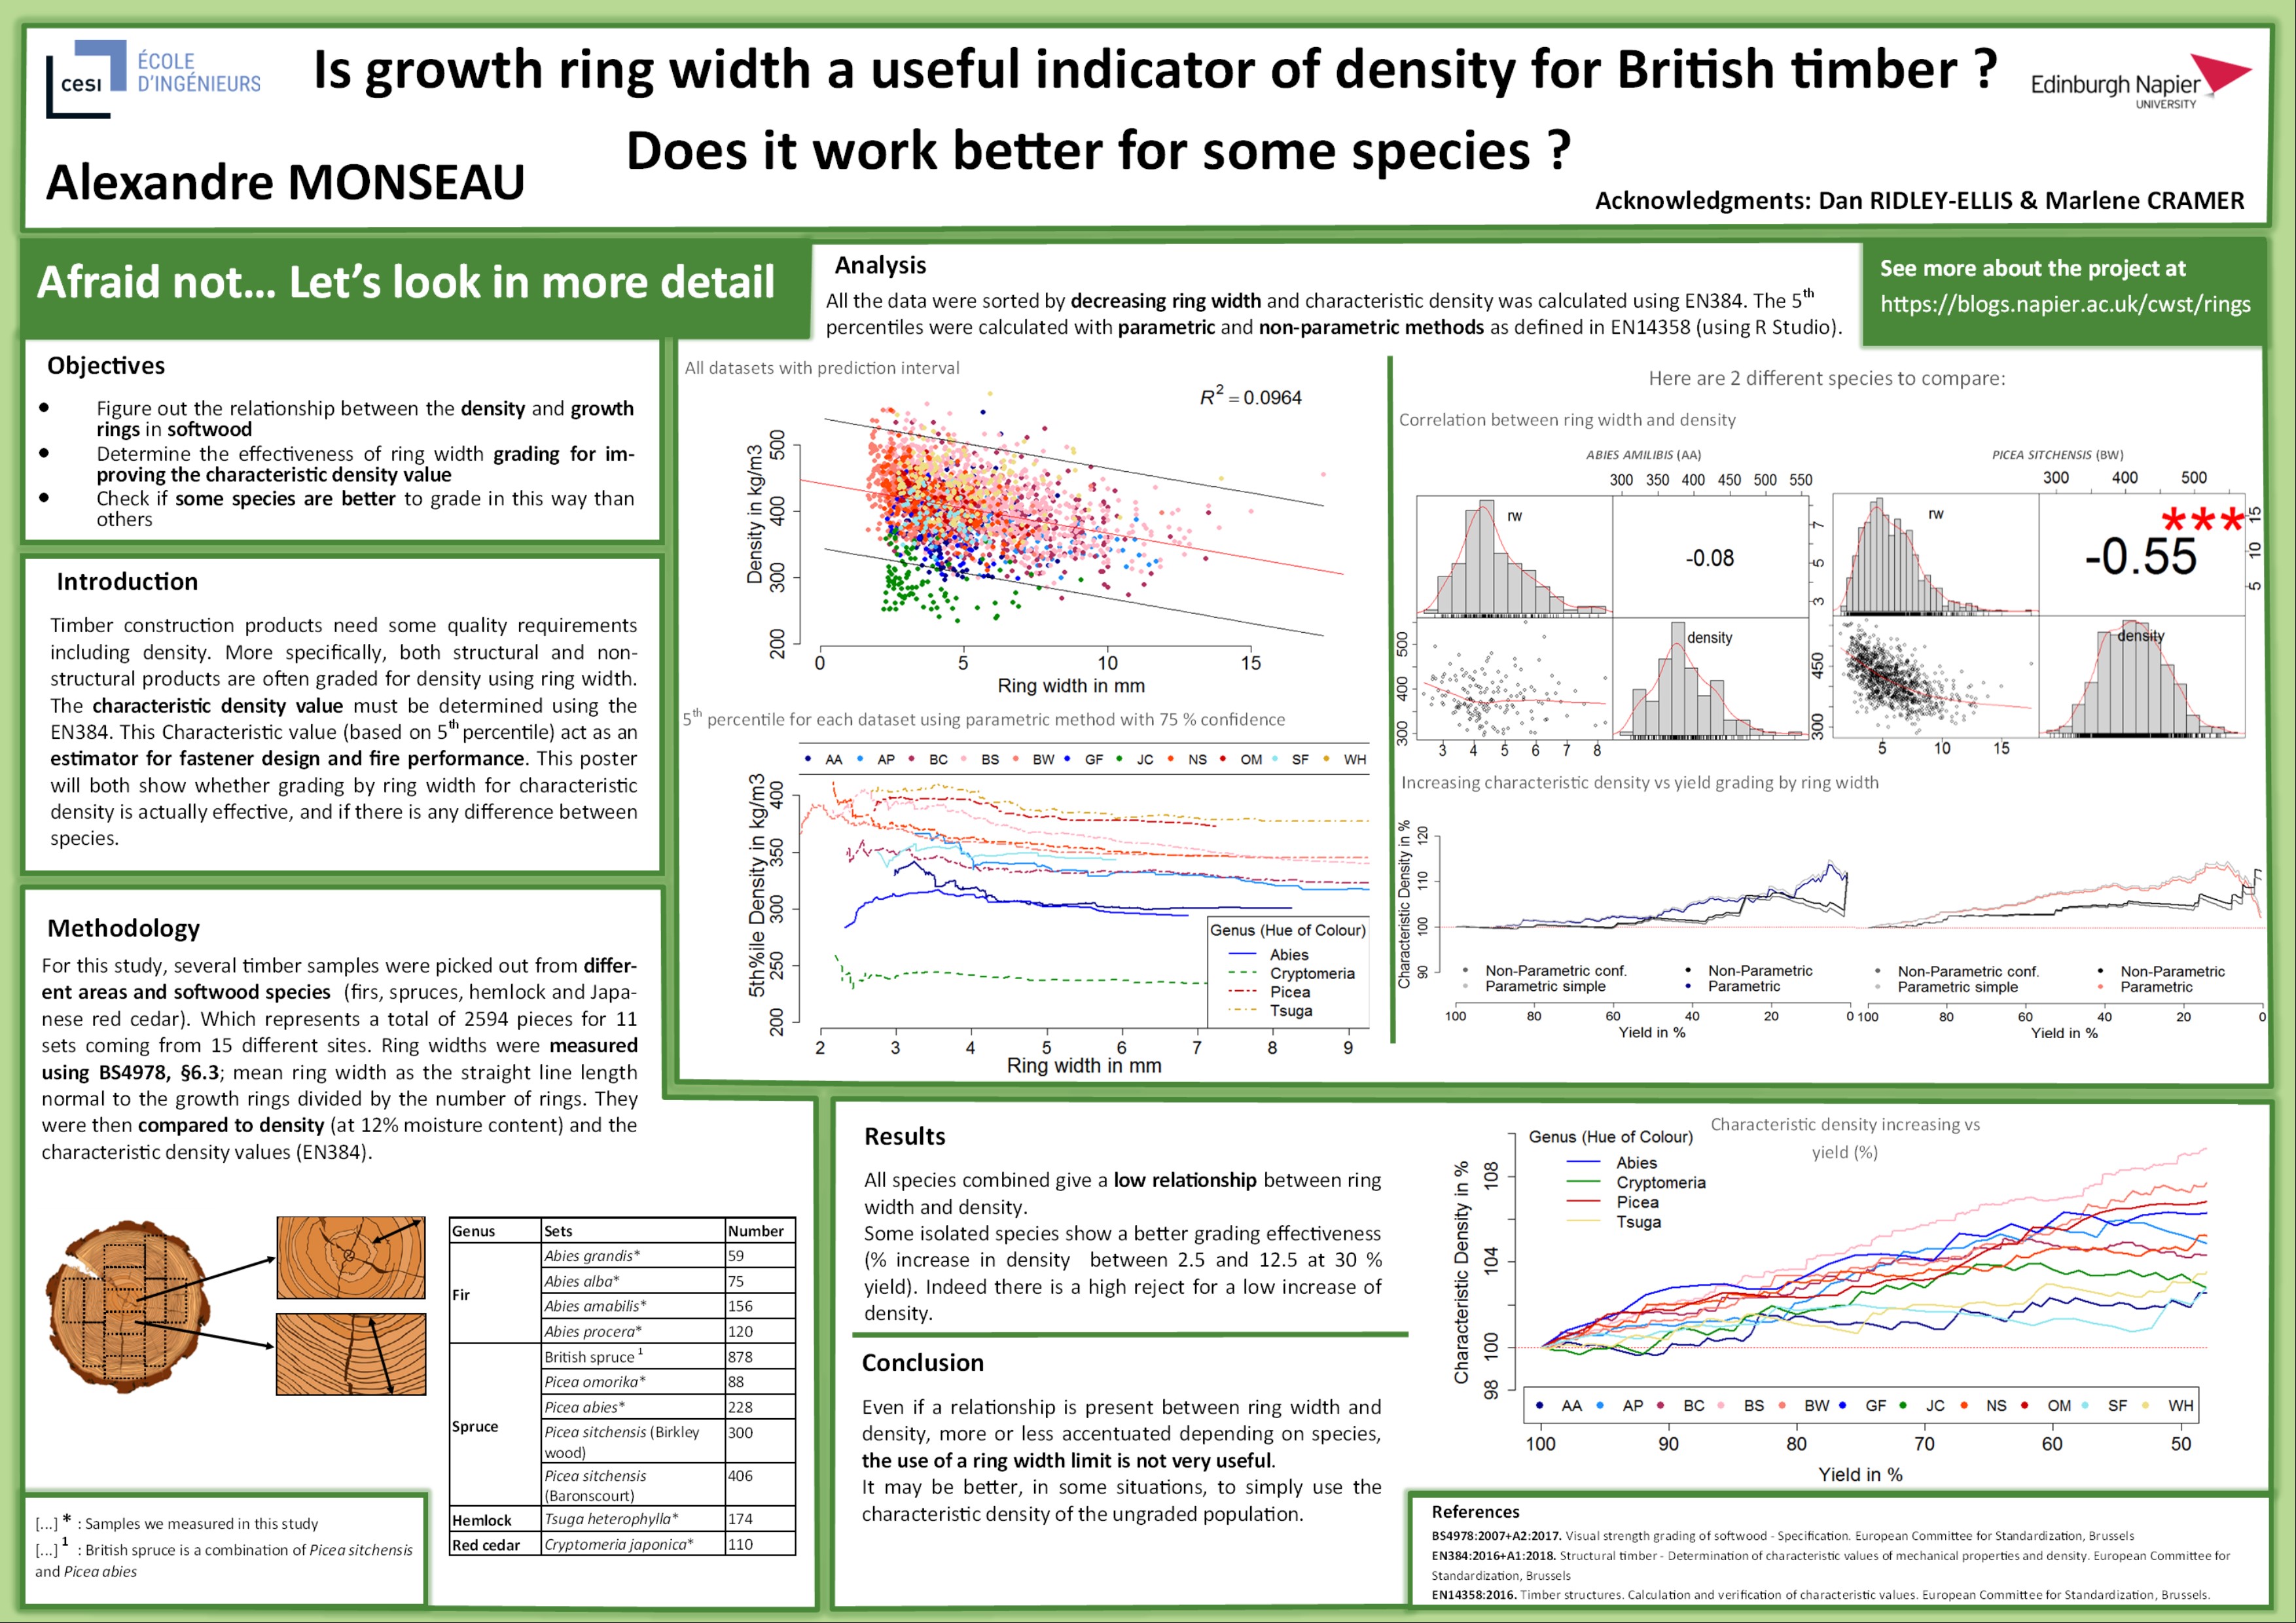
Are growth rings useful for predicting density?
Project report and poster by Alexandre Monseau, with additional commentary by Marlene Cramer and Dan Ridley-Ellis
“Currently studying in an engineering school in France (EI.CESI) and making an apprenticeship in a aerospace company (Stelia aerospace), I specialise my 5th year in the innovation sector. Before my last year at the school, I had the opportunity to make a 5 weeks research internship. The challenge was to understand and apply the research approach. Moreover, the wood domain interests me and I’m very curious about it. The subject was to analyse if growth rings width could be a useful indicator for improving density as a visual grading. So I would like to thank Dan Ridley-Ellis for giving me this chance and Marlene Cramer with whom I could work on this project.”
Alexandre Monseau
Background
It is widely believed that growth ring width is a good indicator of wood density (although the truth is more complex, and the idea of ring width relating to density via the speed at which the tree grows is a misconception)
In conifers, people expect narrower rings to result in wood of higher density because the latewood proportion is higher and latewood is denser than earlywood. Since this sounds very logical and in some cases proved to be true [1], the growth ring width has long been used as a way of doing density assessment in visual grading – indeed EN14081-1 requires that visual grading standards have such a rule if they do not involve direct assessment of density:
EN 14081-1:2005+A1:2011 Clause A.1.3 “Density and rate of growth”
“The grading standard shall contain a requirement for either density or rate of growth.”
EN 14081-1:2016+A1:2019 Clause A.1.3 Density and rate of growth
“For softwoods and temperate hardwoods, the grading standard shall contain a requirement for either density or rate of growth.”
So, for example, if you buy a piece of softwood timber that has been visually graded as GS (General Structural) to the British visual grading standard BS4978 it should not (according to the grading rules) have growth rings that are wider than 10 mm on average. The idea is that, statistically, the pieces with wider rings have lower density, and so by excluding them the density (specifically the characteristic density – the lower 5th percentile) is improved by the grading process – helping with things like strength of connections with fasteners, and fire resistance.
But is that so? Does a grading rule based on ring width actually improve the characteristic density?
Findings
Alex’s study shows that this is in fact not always the case, at least for density and growth ring width (for density and bending strength in Sitka spruce check this previous post in which we see ring width can relate to properties indirectly). In this study we measured the growth ring width and the density of more than 2500 samples from different conifers grown in the UK. The samples formed 11 individual datasets from different species and/or origins and of varying tree age.
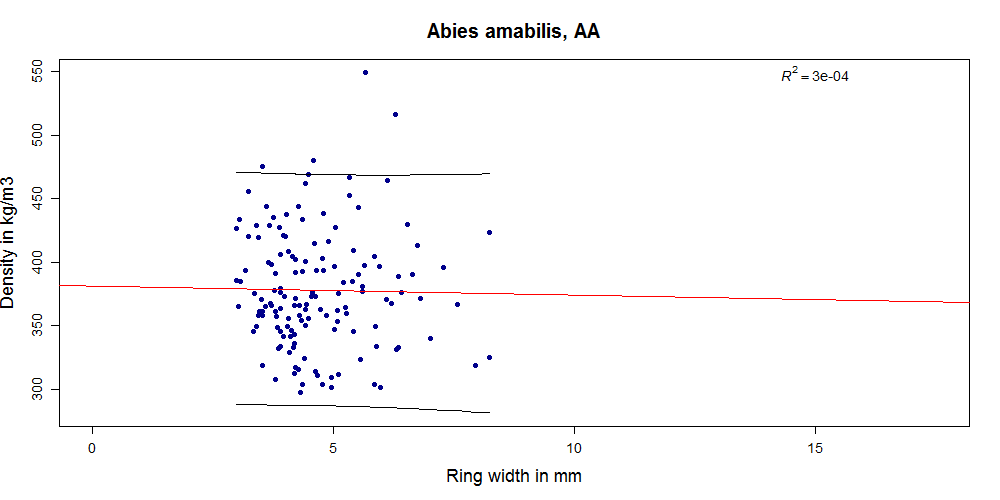
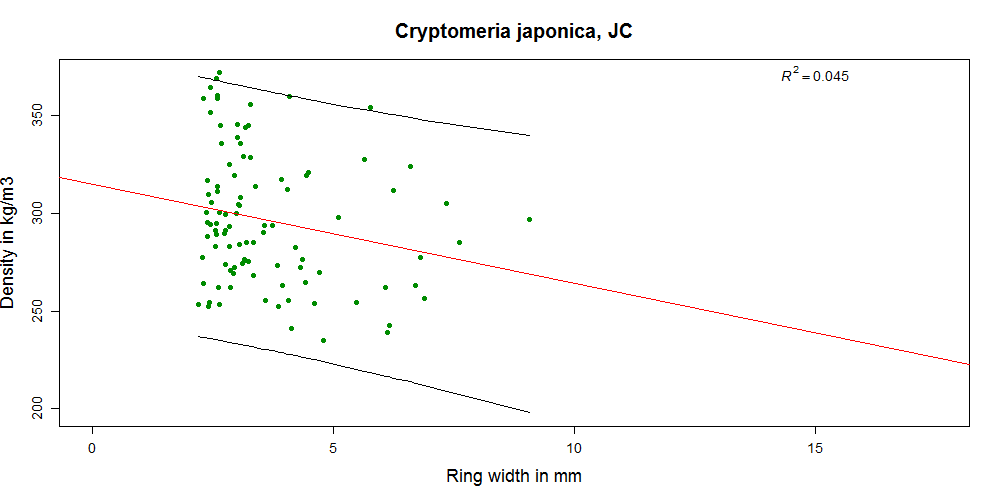
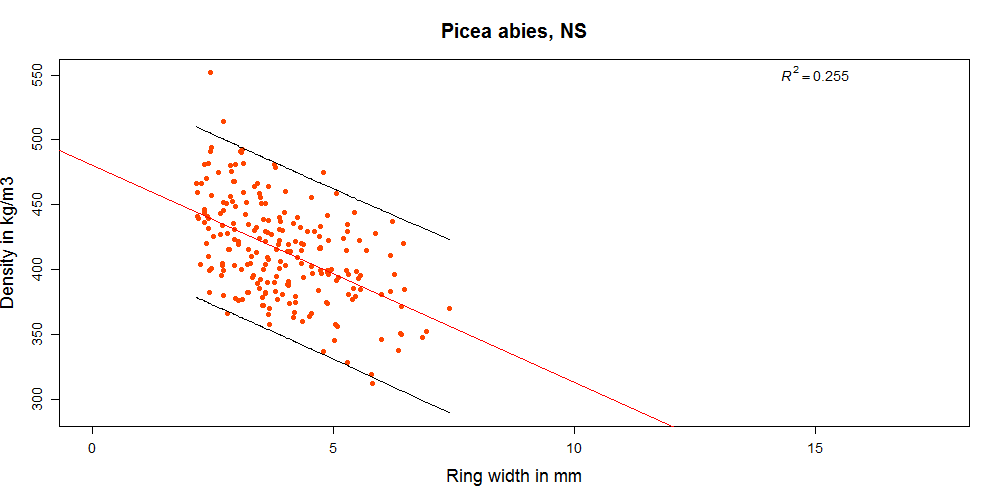
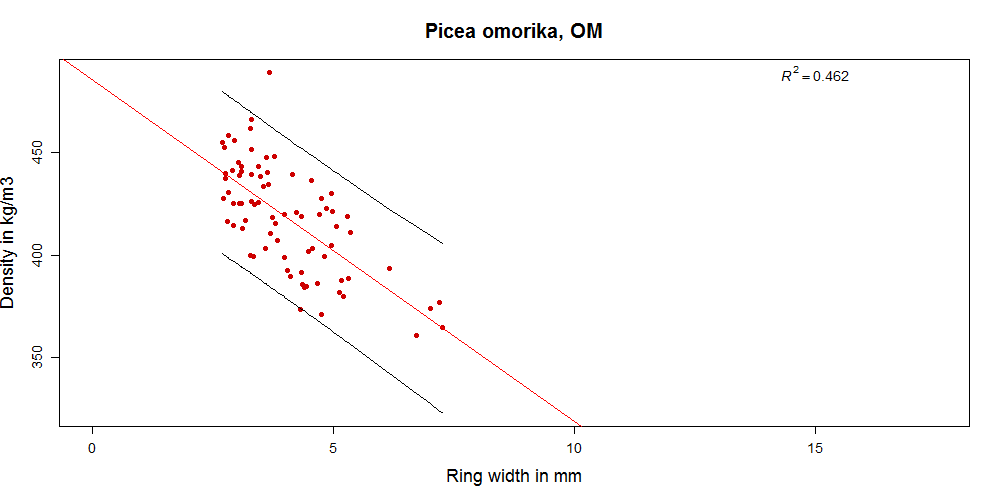
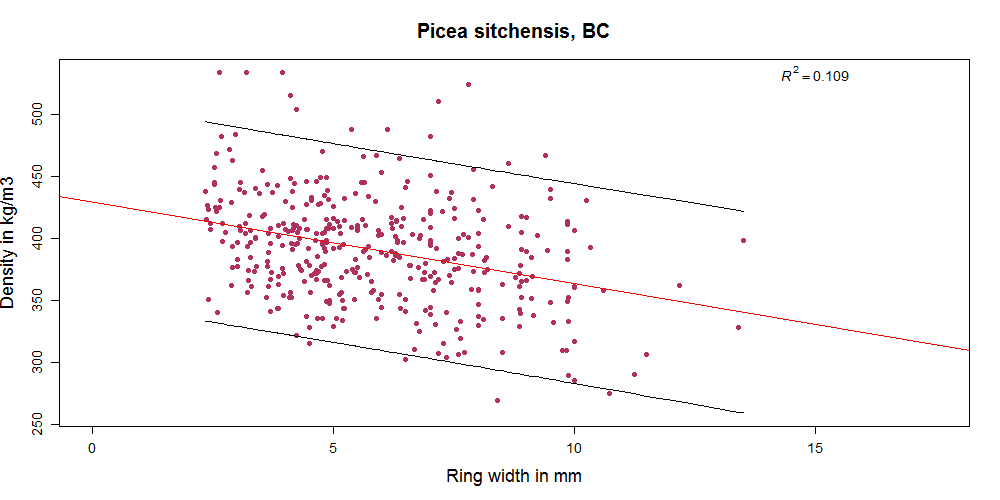
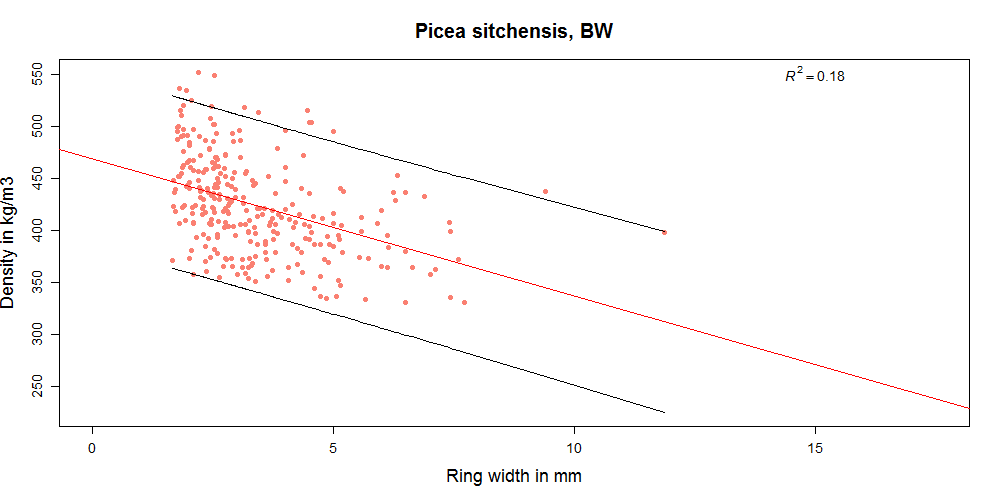
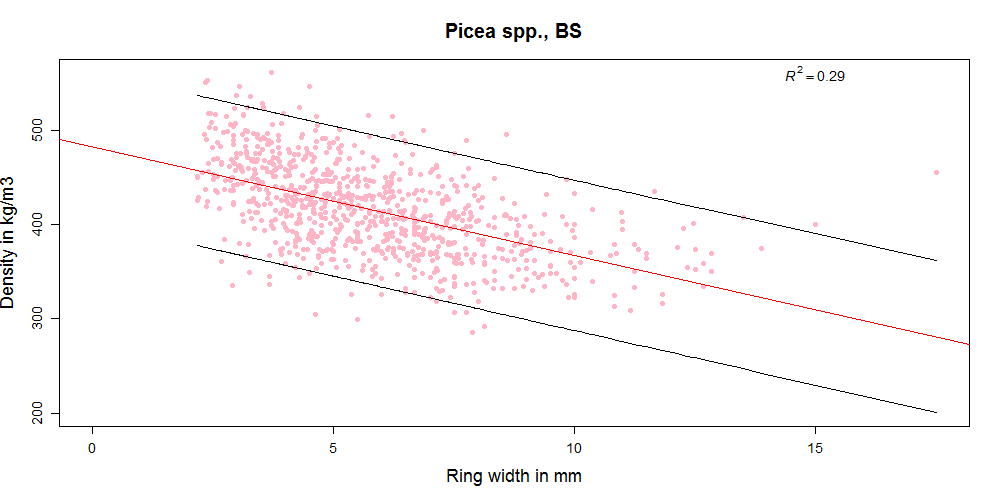
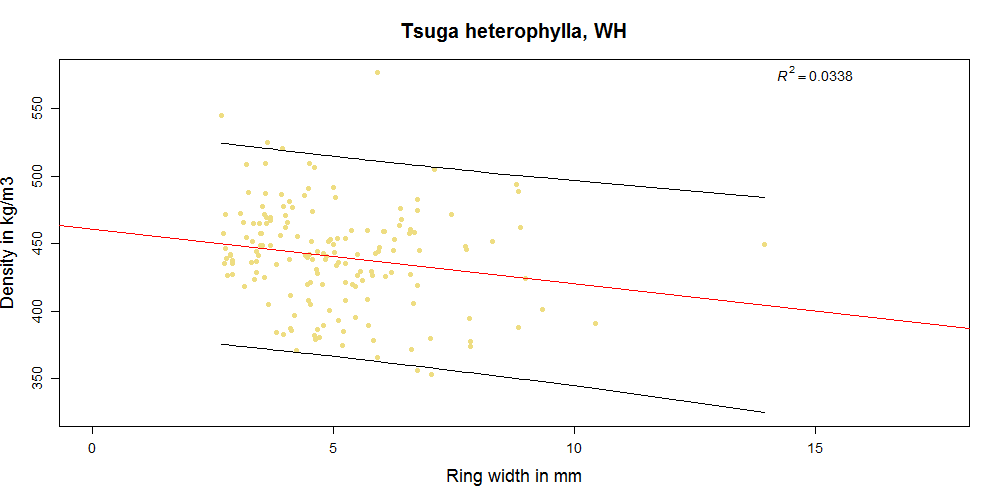
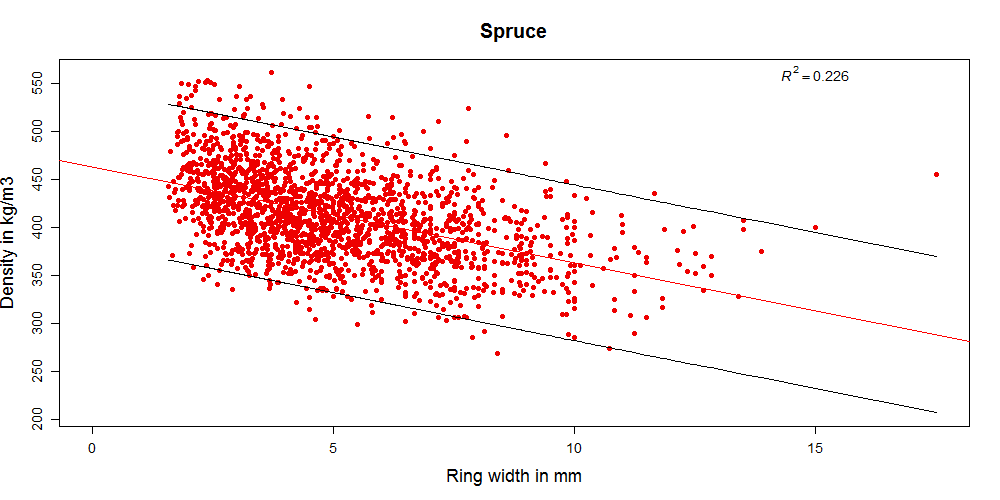
In the diagrams below you can see how density and growth ring width relate for different datasets. The correlation for some sets is extremely weak (-0.08 for Abies amabilis) while for others it is moderate (highest -0.69 for Picea omorika). At least it is always negative, as we would expect it to be (because for softwoods with visible growth rings that have a gradual transition from earlywood to latewood wider growth rings contain less latewood in proportion to earlywood and are thus related to lower density). But even in species where the correlation is best, reliably predicting density of individual boards from growth ring width is not really possible.

However, this is not what the standard aims to achieve – since grading is not about the properties of individual pieces.
Grading standards are designed to reduce the risk of overestimating the properties of construction timber. For density, the lower 5th percentile of the graded timber (collectively) is the critical factor. But in visual grading you don’t usually measure density directly but try to estimate it from (usually) the growth ring width. By rejecting pieces with big growth rings you hope to raise the fifth percentile density of your graded population over the threshold that is needed for the specific grade. So it is not the goal of any grading system to take a piece of timber, measure its average growth ring width of, say, 5.7 mm and estimate its density of, say, 455 kg/m3 from that. Instead we want to know about the 5th percentile density of all the pieces that pass the growth ring limit of the grading rule.
Grading simply wants to systematically reduce a population of timber pieces to one that has better properties than the original population.
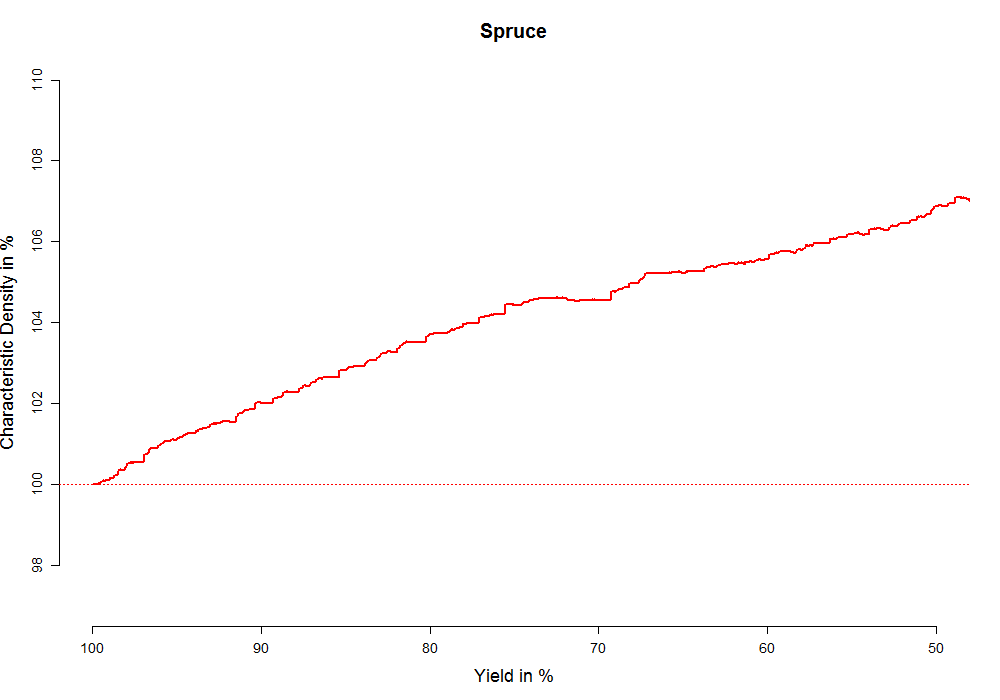
That said, “simply” might still not be so simple in practice. Let’s have a look what actually happens to the 5th percentile density of the datasets in this study, when we remove pieces according to a ring width limit. In the graph below you can see the achieved characteristic density on the y-axis and yield on the x-axis (showing the region 100% to 50%). Characteristic density here is normalised to better compare the datasets. It describes the 5th percentile of the reduced population in relation to the 5th percentile of the whole population – so at 100% yield it is 100%. This way we can see what relative increase in density we get at the cost of rejecting a proportion of the timber based on growth ring width. Yield is 100% minus the reject rate, so the percentage of the population that is accepted (according to our ring width limit applied).

In the graph you see lines for the different species from the study. In addition the colours indicate the genus the species belong to. So for example all species that belong to the genus Picea are in a hue of red.
Now if you have a look at the dark blue line marked with AA (Abies amabilis), you see a decrease in characteristic density for the first 10% of reject, which is the opposite of what grading wants to achieve (this may be a random effect in this dataset). However, for most of the tested species we see an increase in the 5th percentile density for increasing reject rate.
For BW (Picea sitchensis) you see that the characteristic density grows continuously to about 108 % when rejecting 50% of the timber with bigger growth rings. This is very similar to what Dan already published here. But 8% density increase is not huge and in reality no sawmill would want to reject 50% of its timber (and this would be completely unnecessary too). So what we can realistically hope to achieve with this method is < 2% increase of 5th percentile density with moderate reject rates. And it seems to work better for some species than others.
The extent of the study is too small to make general statements for any of the species (although we might have a chance for one of the genera – Picea. See last section of this post).
What does that mean for grading?
So can we hope to increase the density of a timber population by removing pieces with bigger growth rings? Not really. For some populations that might work (a bit) but this depends on the species and most likely other factors that we didn’t consider. Tree age, forestry practices, origin and other growth conditions probably have an impact on both growth rate and density of wood. Even where there is a good correlation between ring width and density, this does not automatically result in an effective way of increasing the lower 5th percentile density.
But what happens to the populations of this study when we apply the rules for growth ring width from the British Standard 4978 for visual grading? That means all pieces with an average ring width of 6 mm or less fall into the SS – “Special Structural” category, of 6 – 10 mm into the GS – “General Structural” category, and with >10 mm they are rejected. Note that here we are only looking at this one criterion from the standard. In reality more factors are taken into account, like knot size and splits (we don’t really expect those to relate to density directly, but knots might indirectly via radial position).
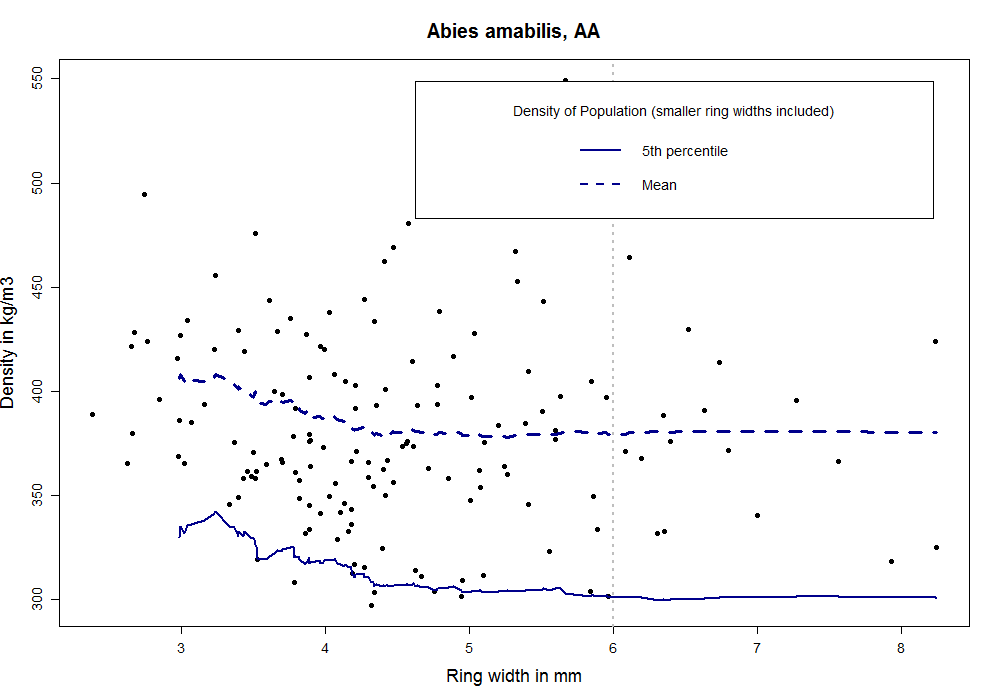
British standard applied for Abies amabilis 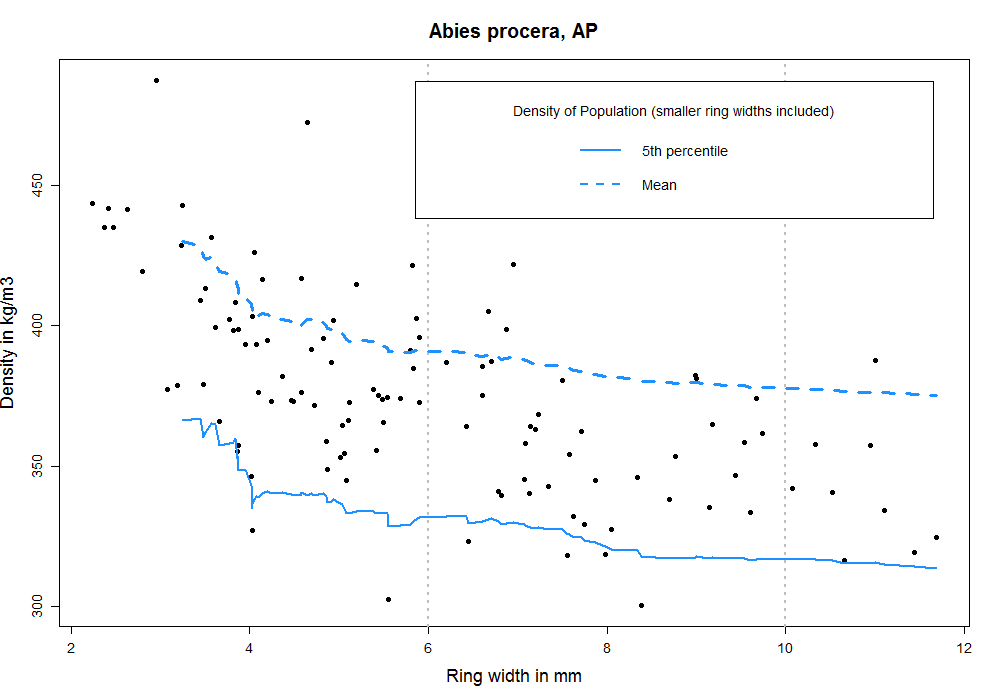
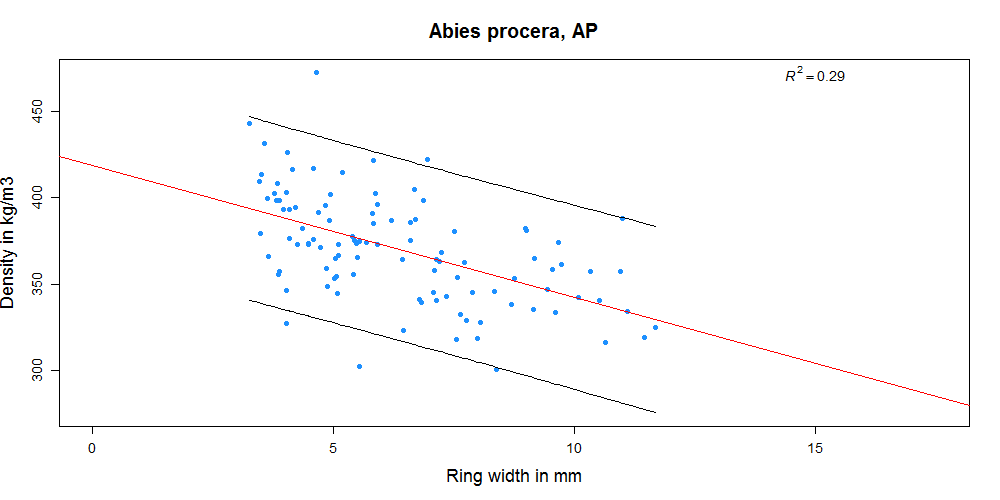
British standard applied for Abies procera
First of all, for many datasets of this study the BS 4978 rules don’t lead to any reject because no pieces have an average ring width above 10 mm. It is worth noting here that some of our datasets are a bit “unusual” because of the type of study they come from. These observations don’t necessarily apply more generally to a species – we are just looking at a general question.
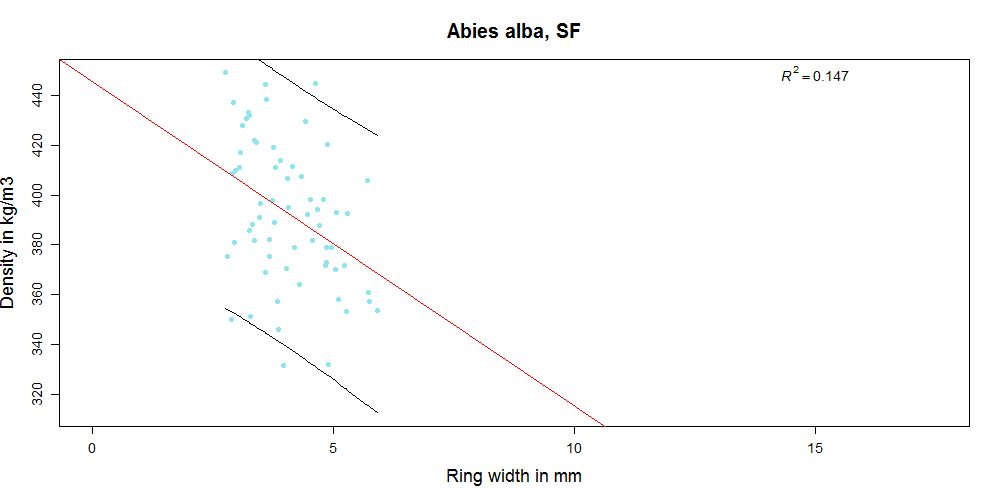
For the remaining datasets the difference in means between the GS and reject group is not significant. For Abies alba all samples fall into the SS category since the average is always smaller than 6 mm. However, the division into the SS and GS class is useful for some other of the species tested. For all datasets except Abies amabilis, Tsuga heterophylla and Abies alba the SS class has a statistically significantly higher mean density than the GS class (p<0.05). See the graphs above as examples (p>0.05 for Abies amabilis and p<0.05 for Abies procera).
So in conclusion the effectiveness of increasing the density of a population by rejecting timber with bigger ring widths is small and might not work at all in some circumstances. This is not really news for wood scientists, but it is not widely known – just because there is a grading rule in a standard it does not mean it actually works (well).
That said, for visual grading there really is no other way of estimating density if you don’t measure it directly – so if it doesn’t result in too much unnecessary reject, or require too much effort in grading, perhaps it is OK?
Spruce in this study
For most species in this study the sample number is relatively small (59 to 172 pieces for all genera except Picea). Also in many cases these are a single site and perhaps only a few trees. We cannot consider this kind of sampling representative.
However, we do have very good sampling for the spruce (Picea abies and Picea sitchensis) covering several sites, many trees, and a good sized dataset.
Picea abies and Picea sitchensis can be treated together because they have similar properties and are often sold together here in the UK (it is the species combination called “British spruce”). So if we cluster the samples from Norway spruce (Picea abies) and Sitka spruce (Picea sitchensis) from 3 different origins and of different ages, this results in a dataset with 1890 pieces. A dataset of this size is much more reliable than the smaller ones for the other species and the data is more independent too.
With the combined spruce dataset we can make a good assessment of how the growth ring width and density relationship can be used in visual grading in spruce from UK and Ireland in general. And it seems that a slight increase in density can be achieved by rejecting bigger growth rings (Graph 2 below). At least the trend seems to be that narrower growth rings indicate higher density. With the rules from BS 4978 only a small percentage of pieces are rejected (2%) and the average density is significantly higher in the SS class than in the GS class (Graph 3 below).
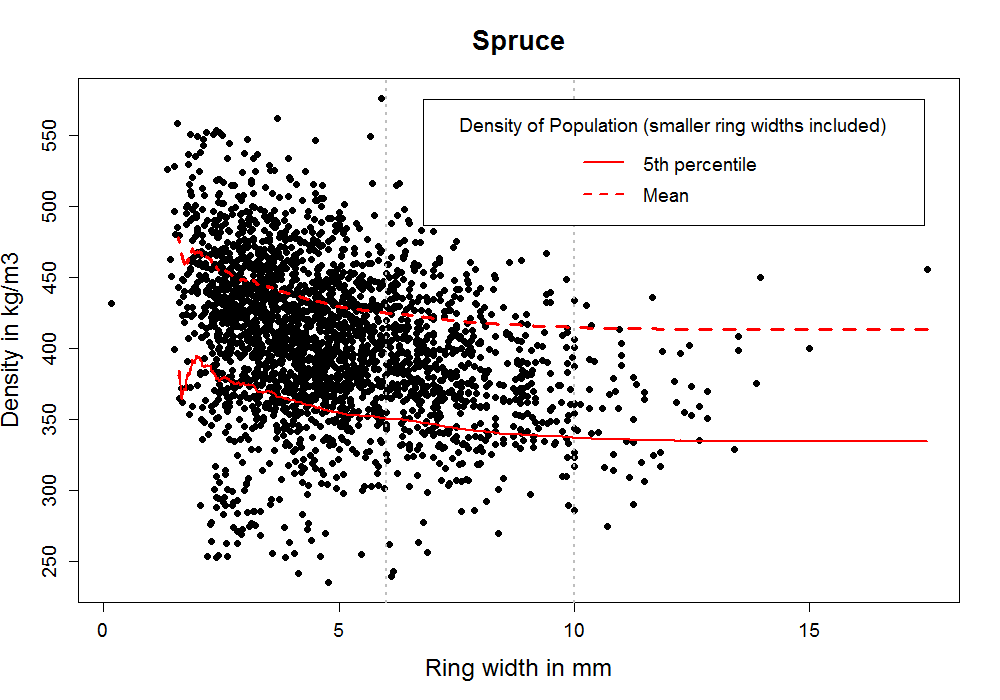
But keeping in mind that these visual strength classes for spruce are assigned to C14 and C18 – this doesn’t really seem to be an achievement anymore. C14 requires a characteristic density of 290 kg/m3 and C18 requires a characteristic density of 320 kg/m3. Even before we did any grading at all the characteristic density was 334 kg/m3. So what was the point?
We already know that density is the least limiting factor for strength grading in home grown spruce (and many other British softwoods). Instead stiffness is critical. Since stiffness is easily measured using non-destructive tests like acoustic velocity which is used in many grading machines, it seems machine grading is preferable to visual grading with the current rules.
Again we come to the conclusion that counting growth rings is not really worth the effort. However, in lack of any other indicating factor, we might as well use it for visual grading – at least in cases where we need to be concerned about the density in grading.
[1] Petty, Macmillan, and Steward, ‘Variation of Density and Growth Ring Width in Stems of Sitka and Norway Spruce’; Lindström, ‘Basic Density of Norway Spruce. Part II. Predicted By Stem Taper, Mean Growth Ring Width, and Factors Related To Crown Development
Leave a Reply
You must be logged in to post a comment.