

There is a very large amount of data in Gwendoline M. Lavers, “The strength properties of timber” (Building Research Establishment, BR241, 3rd ed. / revised by G.L. Moore, 1983) but it is hard to compare one species to another when presented with tables of numbers. Here I present a more digestible form of data presentation – the “Scotch egg” of wood properties.
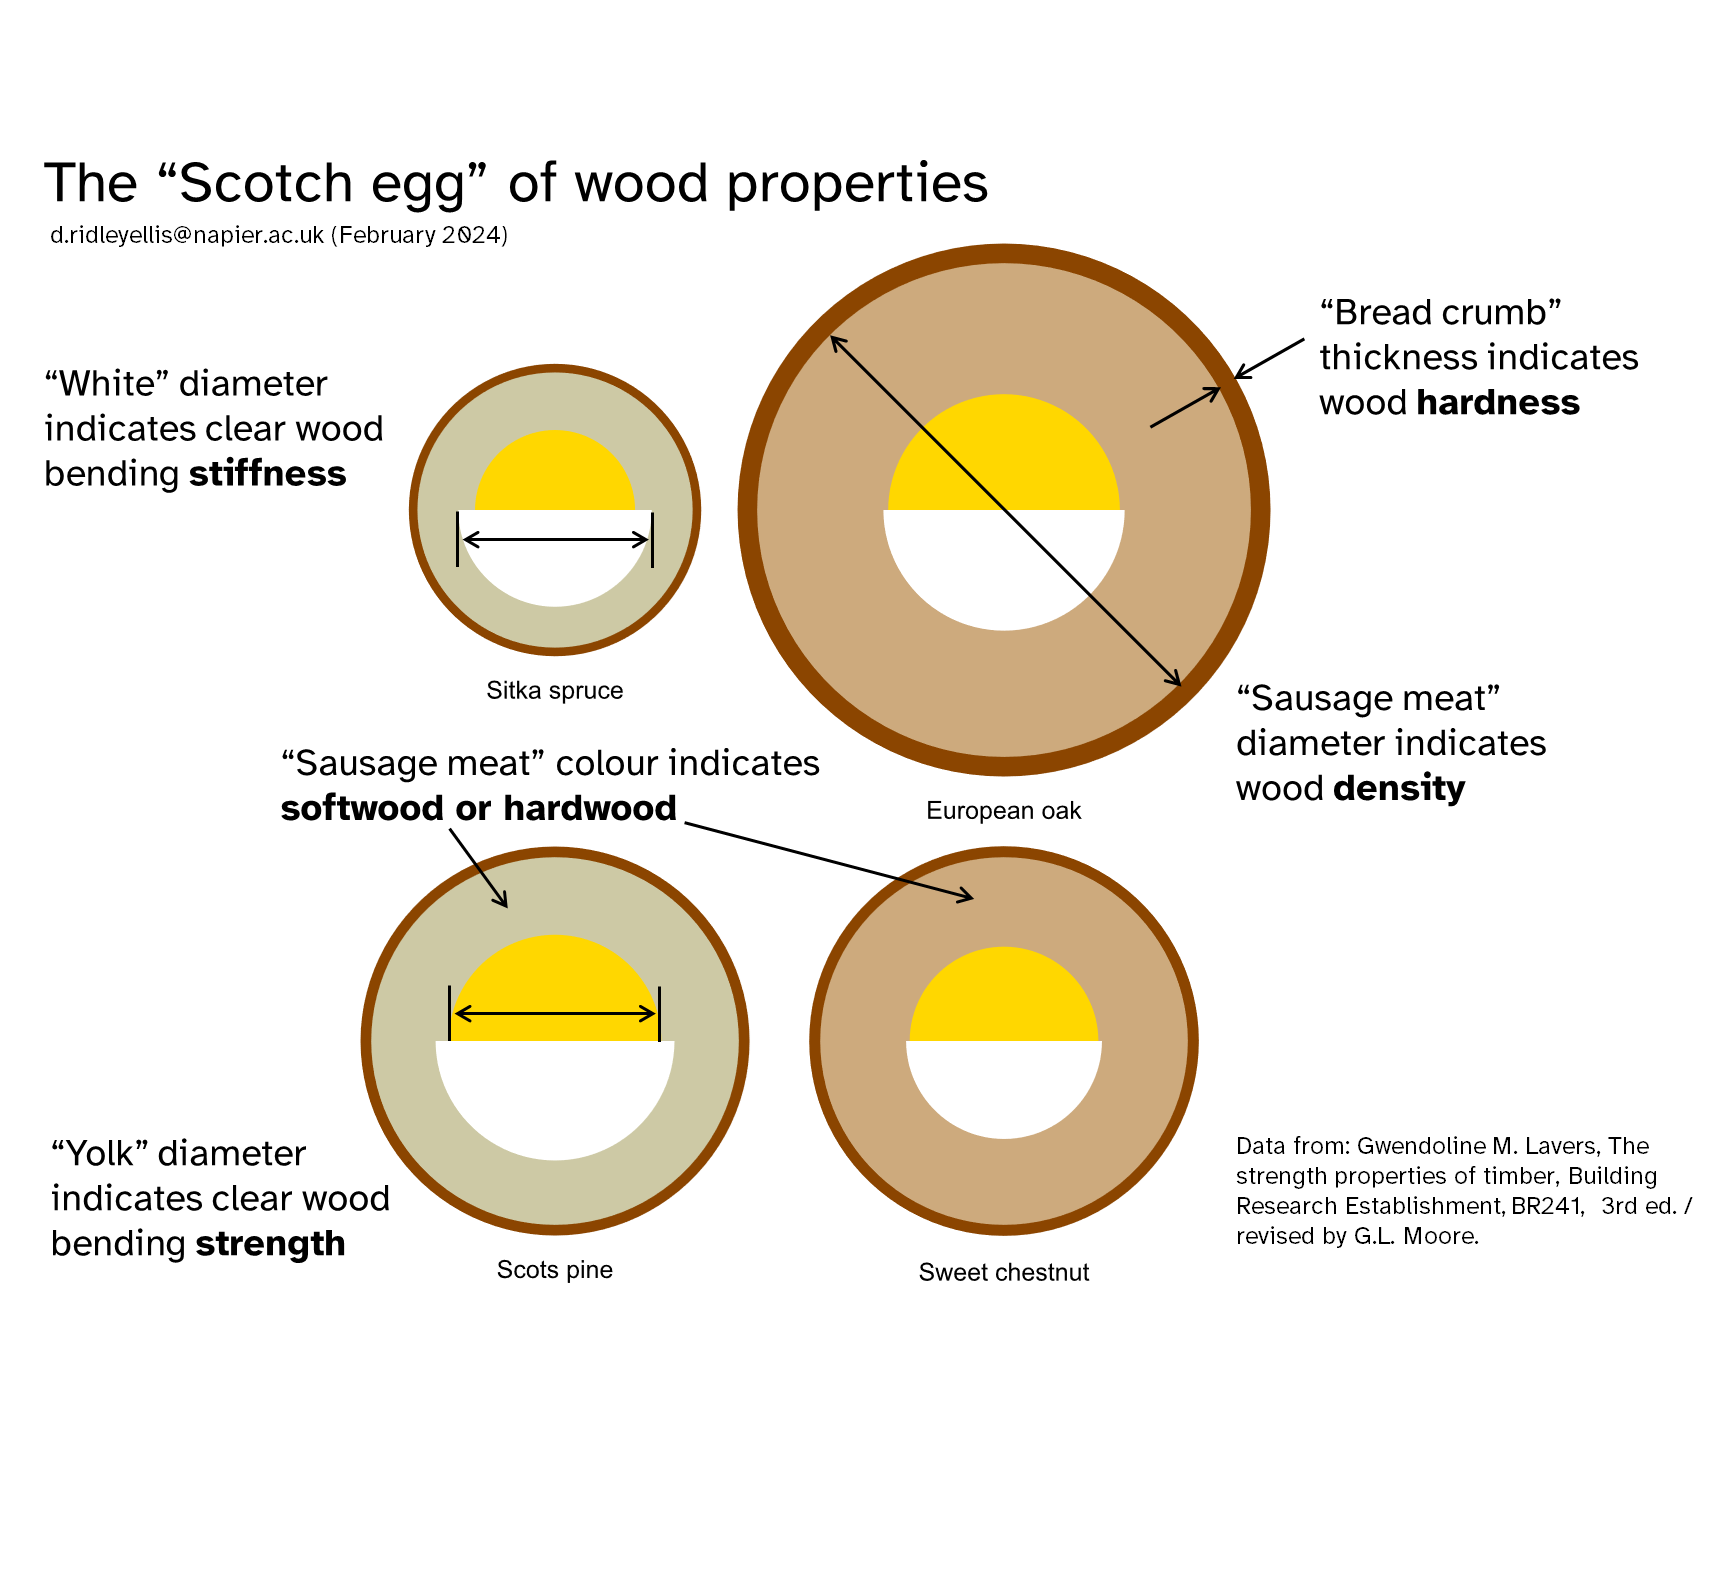
How to read a “Scotch egg”:
The “sausage meat” diameter indicates wood density. Be aware this is diameter not area so differences in density are visually emphasised.
The “sausage meat” colour indicates whether it is softwood or hardwood.
The thickness of the “bread crumb” outer layer indicates wood hardness.
The “yolk” diameter indicates clear wood bending strength.
The “white” diameter indicates clear wood bending stiffness.
Things to be aware of when comparing the data:
The data is small clear testing, with adjustments from older standards (yes even older than BS373:1957).
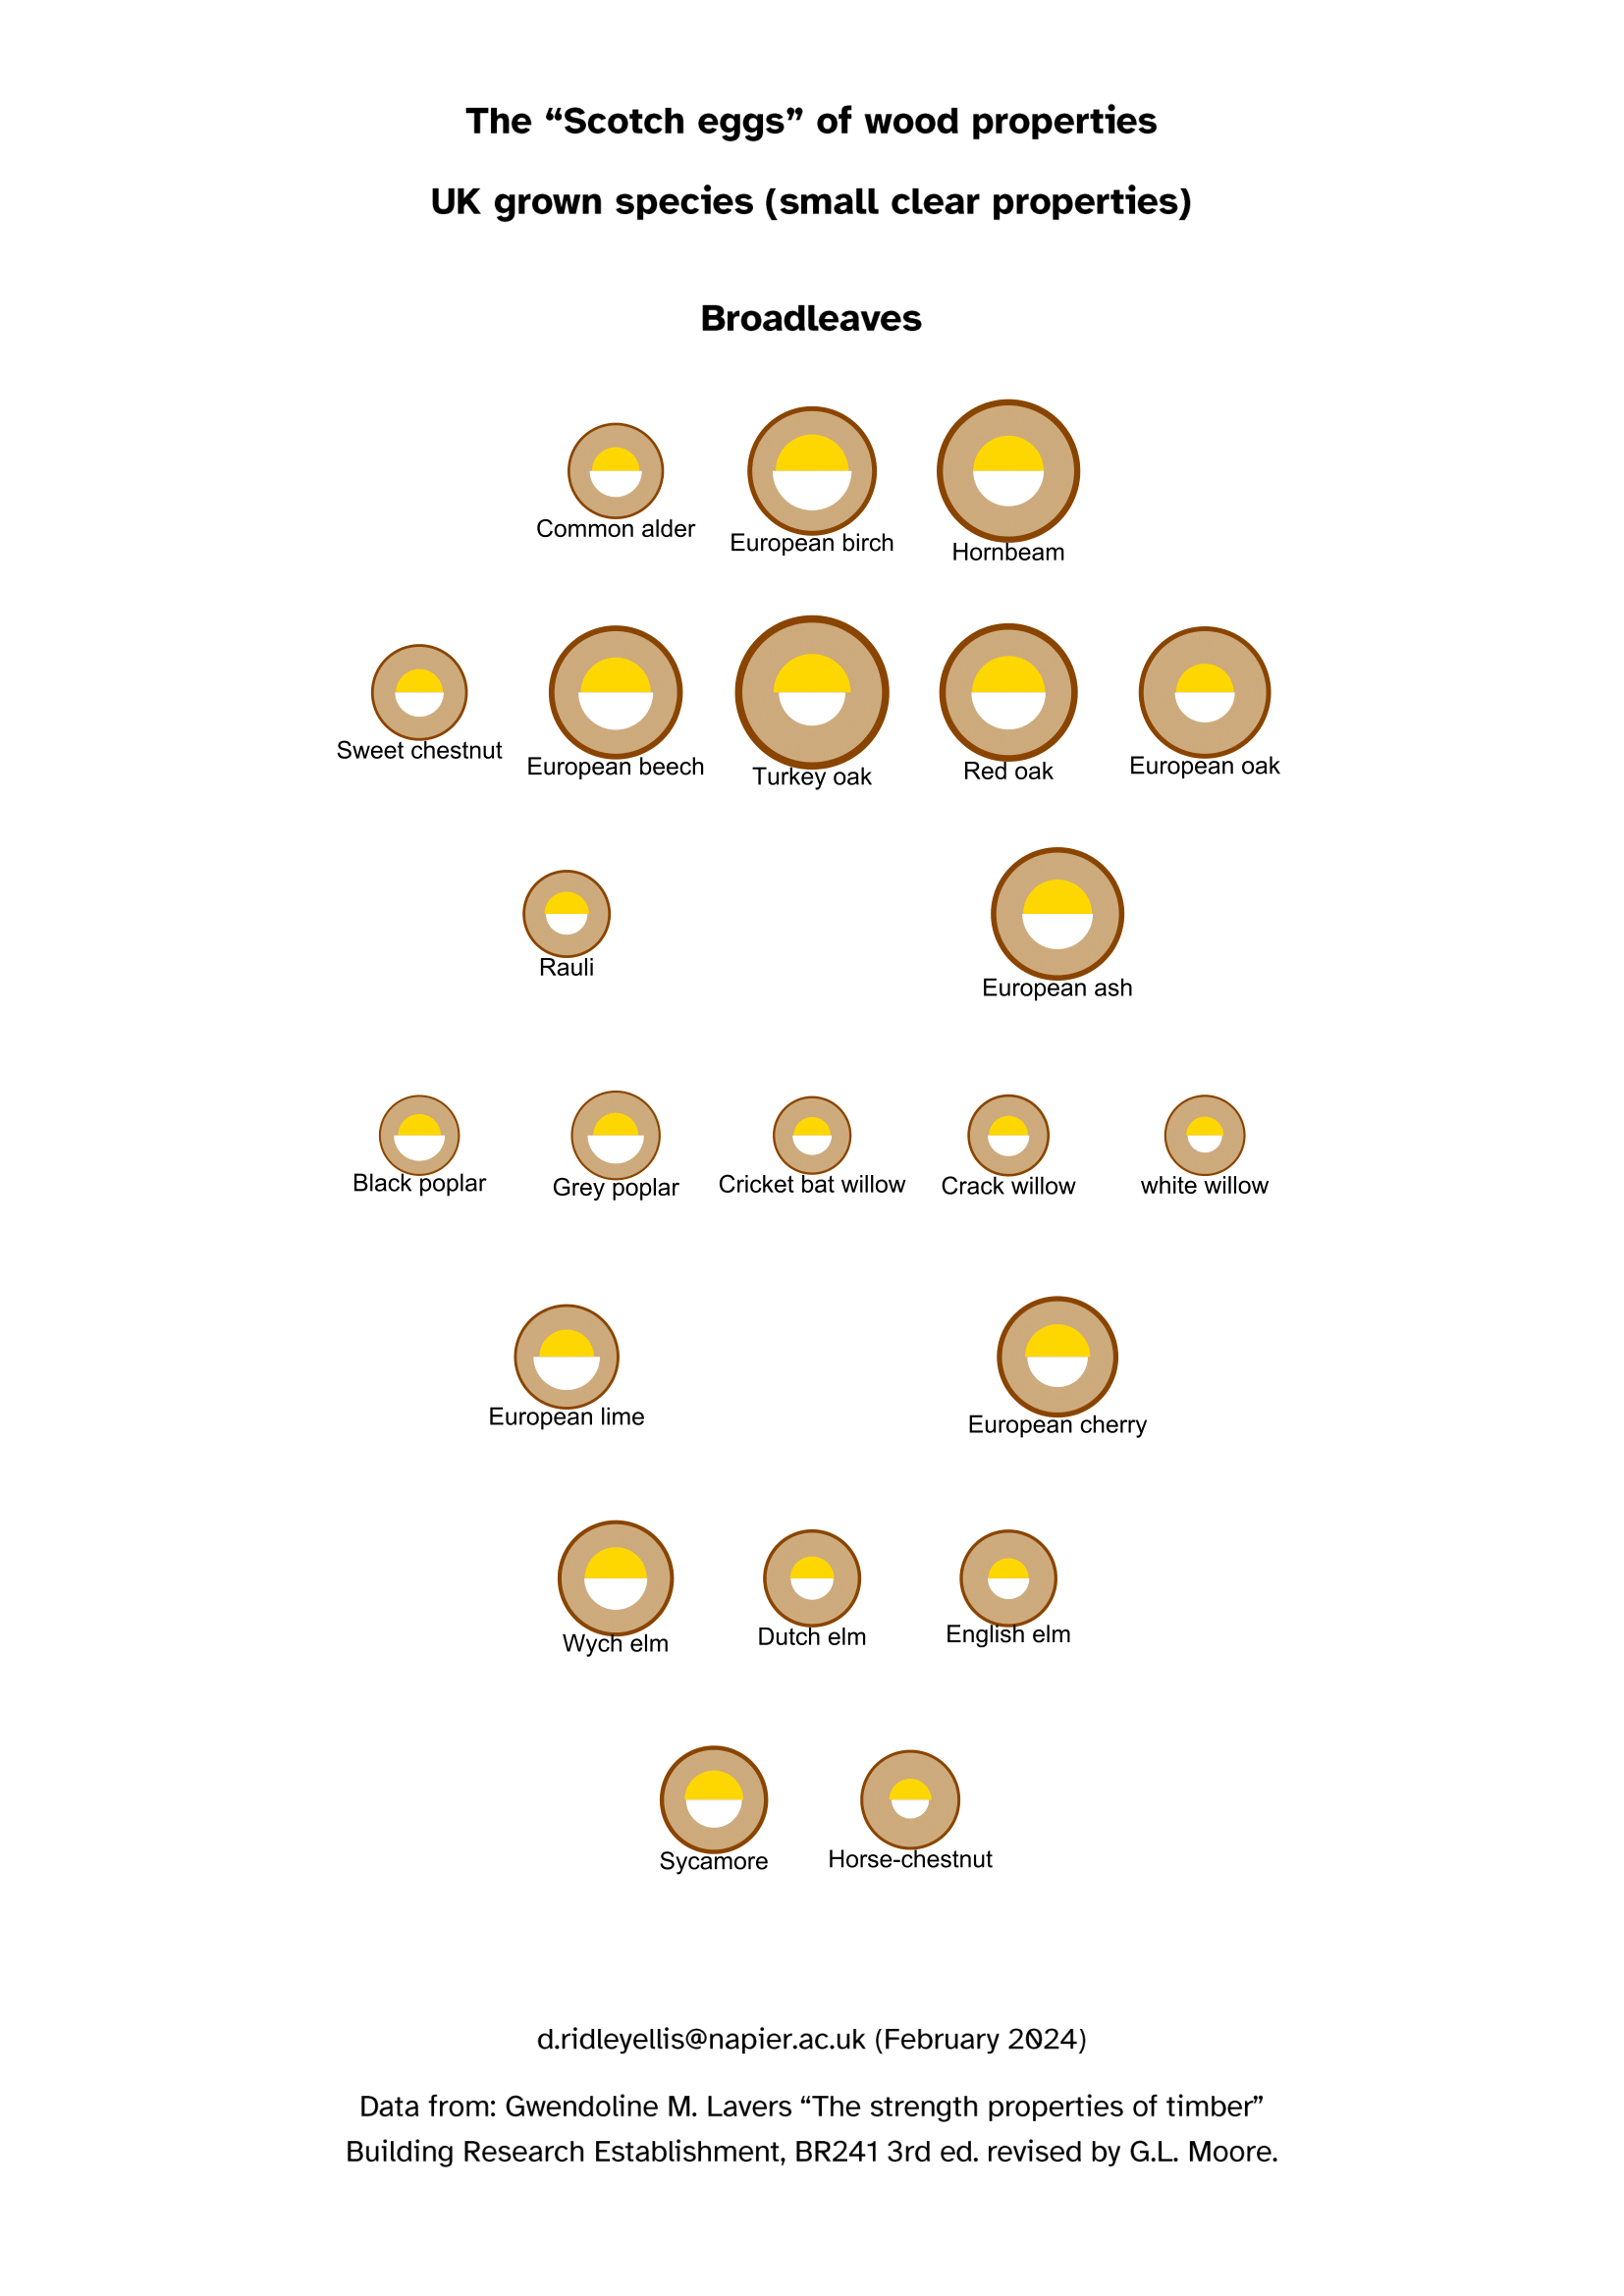
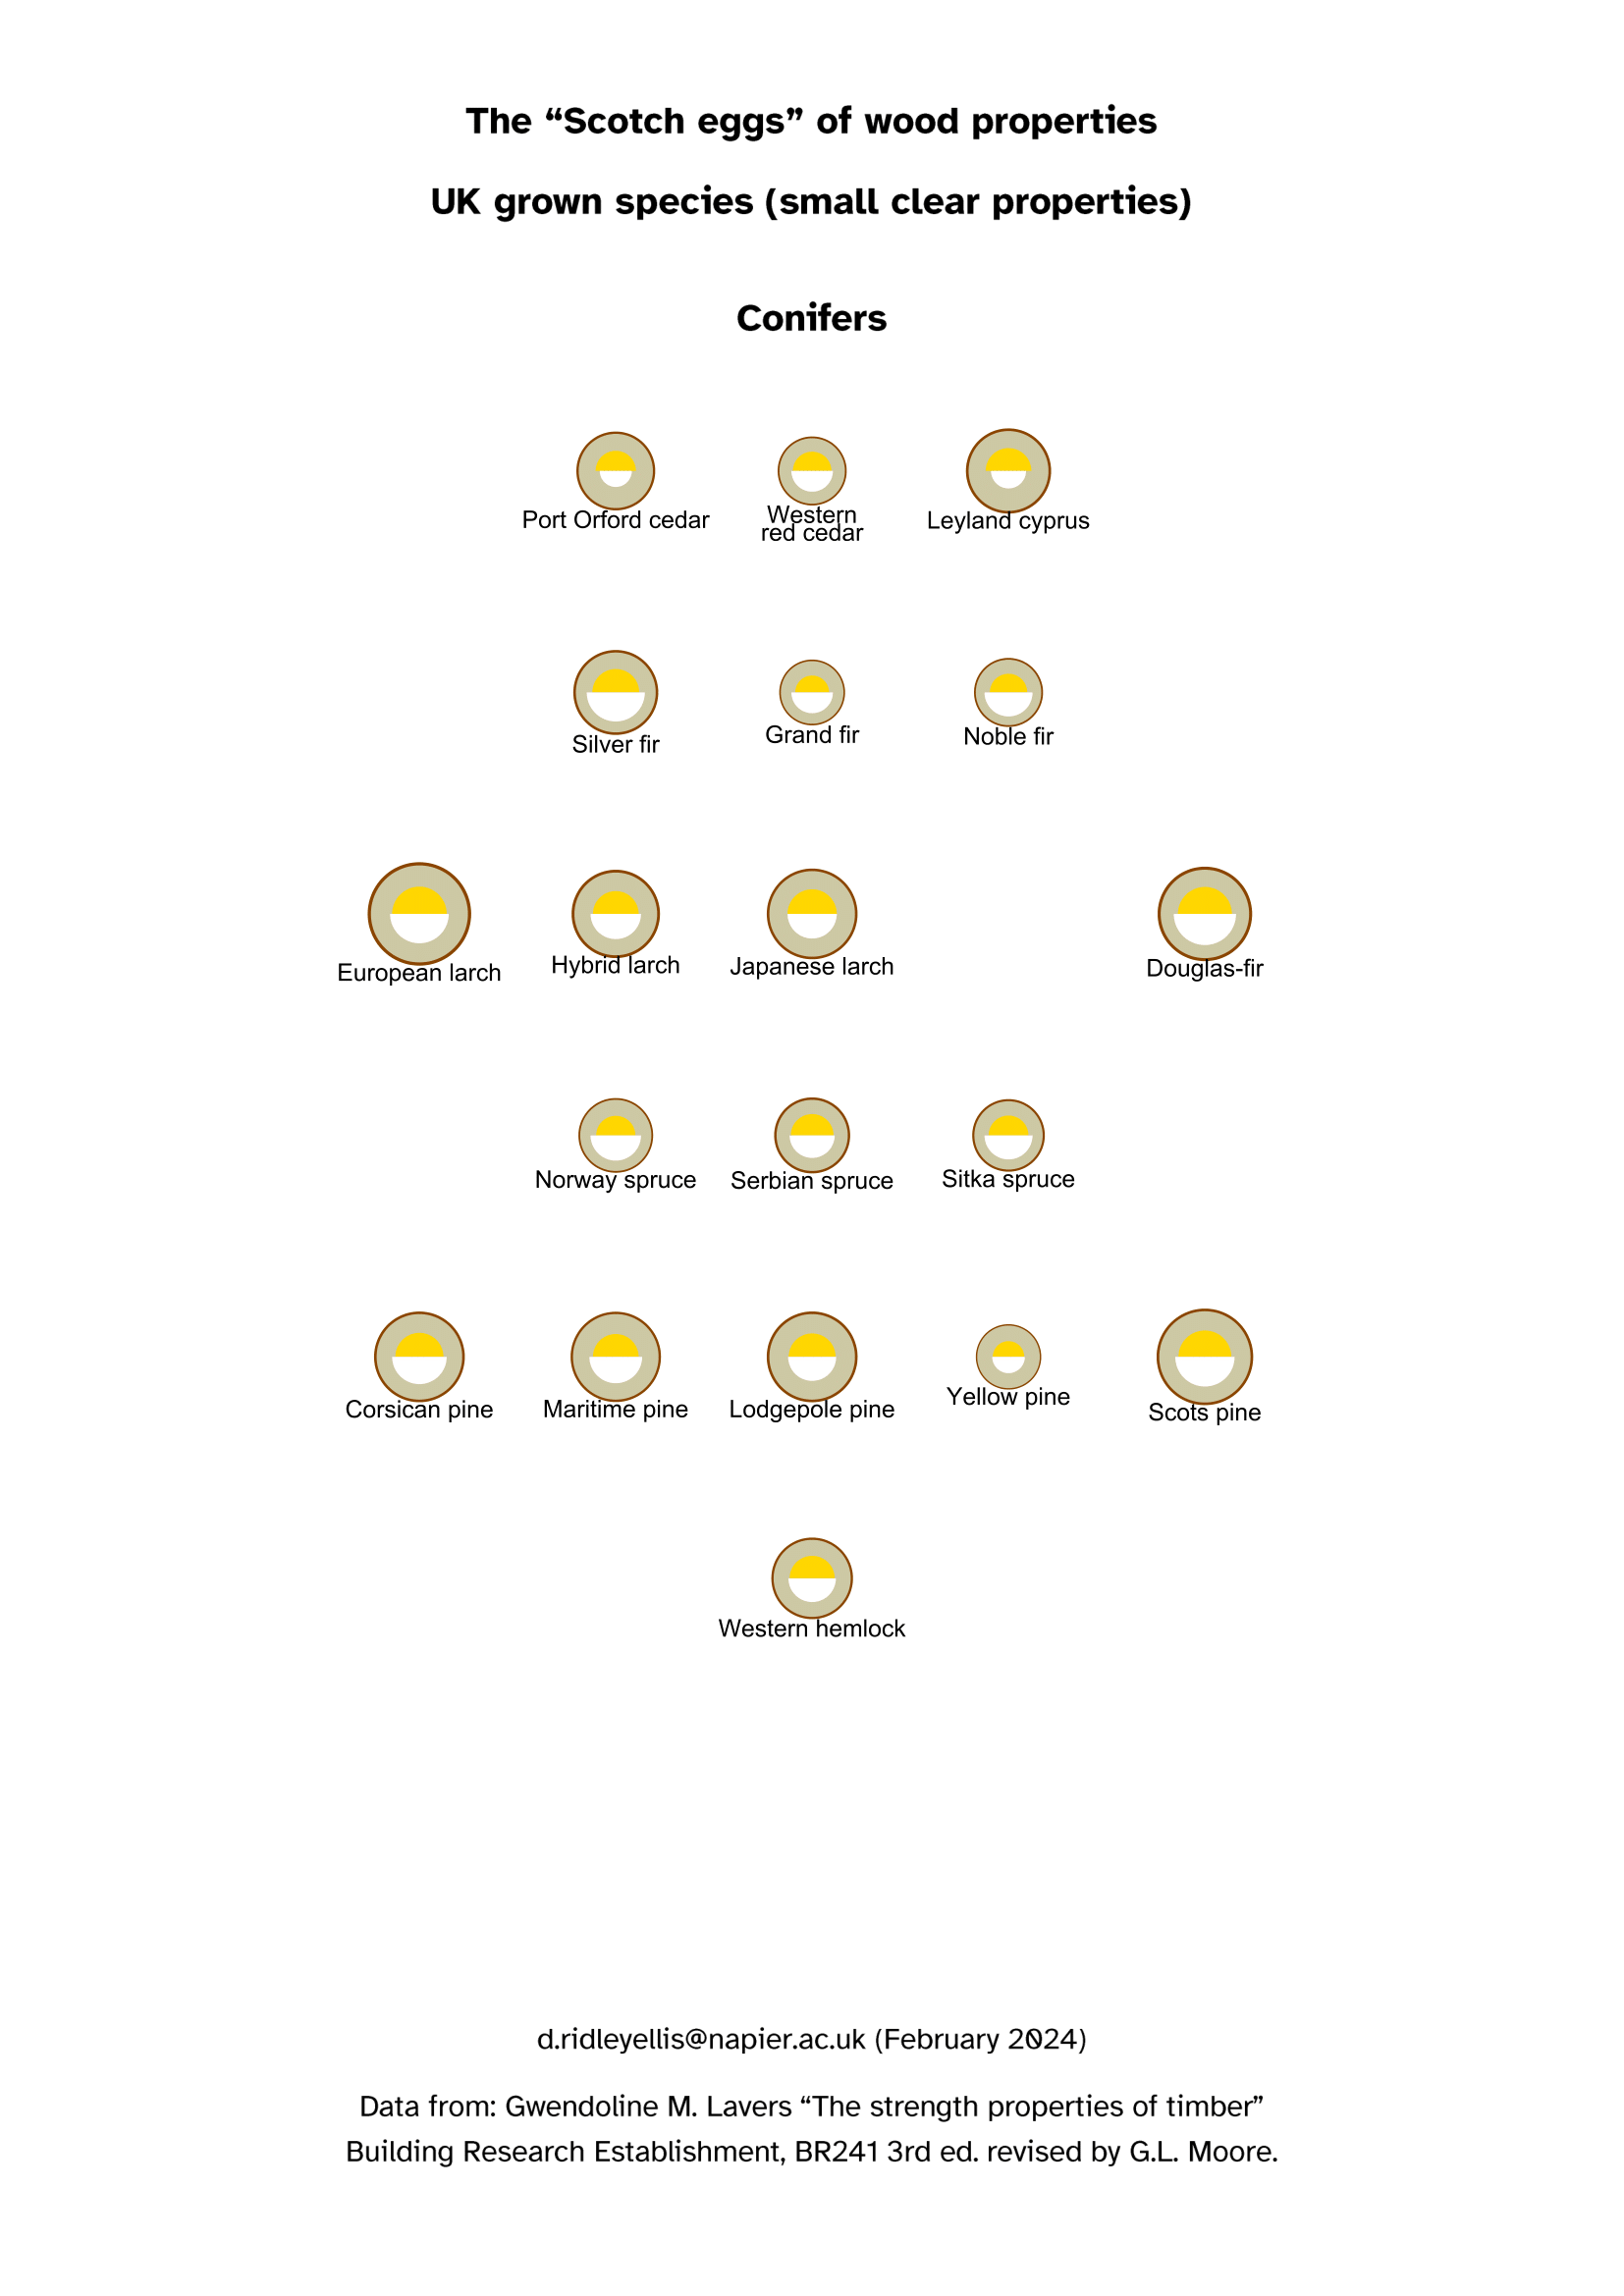
The species datasets can be very small and we don’t know how representative they are of the current resource. For example, the apparent differences between European, Japanese and hybrid larch is possibly not meaningful for the modern resource.
Within a species there is a lot of variation. This presentation is based on mean.
If you are curious about the author of the report, Gwendoline Merrin Lavers, see TTJ Talking Timber for November/December 2023.
The diameters are scaled as follows:
Scale the density (sausage) as kg/m³ / 1000
Scale the strength (yolk) as N/mm² / 300
Scale the stiffness (white) as N/mm² / 30000
Scale the side grain Janka hardness (bread) as N / 50000
(outer diameter is therefore scaled density + hardness / 100000)
The colours, as named in R:
yolk = “gold”
white = “white”
sausage.soft = “lemonchiffon3”
sausage.hard = “burlywood3”
bread = “darkorange4”