We have not resolved the issue with embedding Sketchfab models into our WordPress deployment so what you see here will likely appear broken in one way or another. Depending on how it is broken in your browser you may be able to figure out how to open the models on Sketchfab directly. Failing that, hop over to this collection and open the relevant model.
This is a quick version of educational materials used in our courses – to work as a companion to publicly available 3D models you can find on Sketchfab.
Let’s start with looking at a very simplified model of a log. We’ll use some colours to represent the key parts: the pith (white and orange), the heartwood (red and yellow, the sapwood (blue and green), the knots (black) and the outside of the log (grey). Here the knots are indicating where branches have been removed from the log. In real logs, branches that are removed while the tree is alive result in knots that do not come through to the outside, but for simplicity we will not include those in our simplified model. Here all knots begin at the pith and expand out towards the surface. Look at the model and imagine how the knots look inside the log. Note that the model includes a taper (change in diameter).
By making the wood semi-transparent, we can reveal the knots inside. In real wood things are not as straight and perfect as this, but the key features are present. The nature of the knots and their distribution depends on species and growth conditions. This model resembles a typical commercial conifer in that the branches were relatively small, tilted slightly upwards (in the living tree), and occur at ‘nodes’ / ‘whorls’ along the length.
(Not all commercial conifers are ‘uninodal’, and many do not have visibly distinct heartwood and sapwood)
Let’s have a look at how this log might be sawn. Here we have a flat-sawn kind of cutting, as is typical for making wide boards. Note how the direction of the cut, relative to the features of the log, changes how those features appear on the cut surfaces. Knots and growth rings are intersected at different angles. Wane (the edge of the log remaining in the sawn timber) also depends on the kind of cut.
The growth rings are represented here by alternating bands of colour. The growth rings, and how they appear to the eye (‘figure’) also vary by species and growth conditions, but you can see how there can be big differences depending on the angle of the cut relative to the radial and tangential direction of the growth rings. Look at the model and imagine how the knots run within the sawn timber. Visualising the structure of knots inside the wood is part of many visual grading approaches.
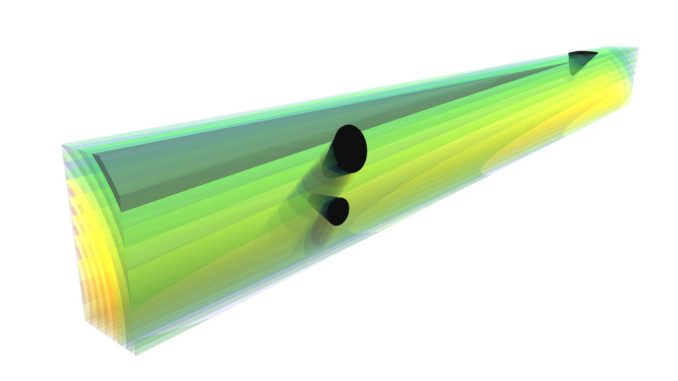
My making the wood semi-transparent, we can look inside at those knots again. Notice how the angle of the knots, relative to the faces, changes how they appear on the surface. Notice also how the direction of the knots relates to the growth rings.
Let’s look at the same log cut in another way – if we want our sawn wood to be more like blocks than plates. Notice how this affects the knots and distribution of heartwood and sapwood in a different way. Have a think about what kind of cuts would be good for internal structural timber, and which kind would be good for making cladding boards without sapwood. How do knots affect the quality for those kind of products and how does the cutting pattern affect how those knots appear in the sawn timber?
Again, with transparency, we can look at the knots inside the wood. Notice how knots can appear large on the surface, but not take up much of the cross-section inside – or be quite large inside the wood, but appear quite small on the surface. How would you be able to tell these apart by looking at the outside of the wood?
Now we’ll look at the difference between boards with width parallel to the radial and tangential directions of the growth rings. This model shows disks of the original log so we can see where the wood comes from. There is a huge difference here for the knots, sapwood, heartwood and appearance of the growth rings on the surface of the wood. These differences can be very important for some uses, so there are different log cutting patterns for different markets.
Not let’s look at the boards without those disks. Examine the knots, and visualise how they are inside the wood.
Yep – you guessed it – we’ll use transparency to check our imagination. But instead of making the boards transparent, let’s add in the ghost of the log.
So far so good. But when we are dealing with sawn timber, we often don’t have the log for reference. So what about this big lump of sawn timber? What can be said about this?
Time to put in the x-ray spectacles and look inside. Again, remember, this is an idealised model and real wood is not as simple as this.
What if we re-saw that big lump? What might we get? Can you make sense of what you see on the outside compared to what is inside?
Put those x-ray specs back on for a moment.
OK – so now let’s look at a few other bits of sawn timber. Try the same game – examine the outside of the wood and visualise what is inside. Note that the cut directions don’t necessarily run exactly parallel with the axis of the log.
One final model – a real close up look at softwood structure. Why can we see growth rings – what is the difference between earlywood and latewood?

Leave a Reply
You must be logged in to post a comment.